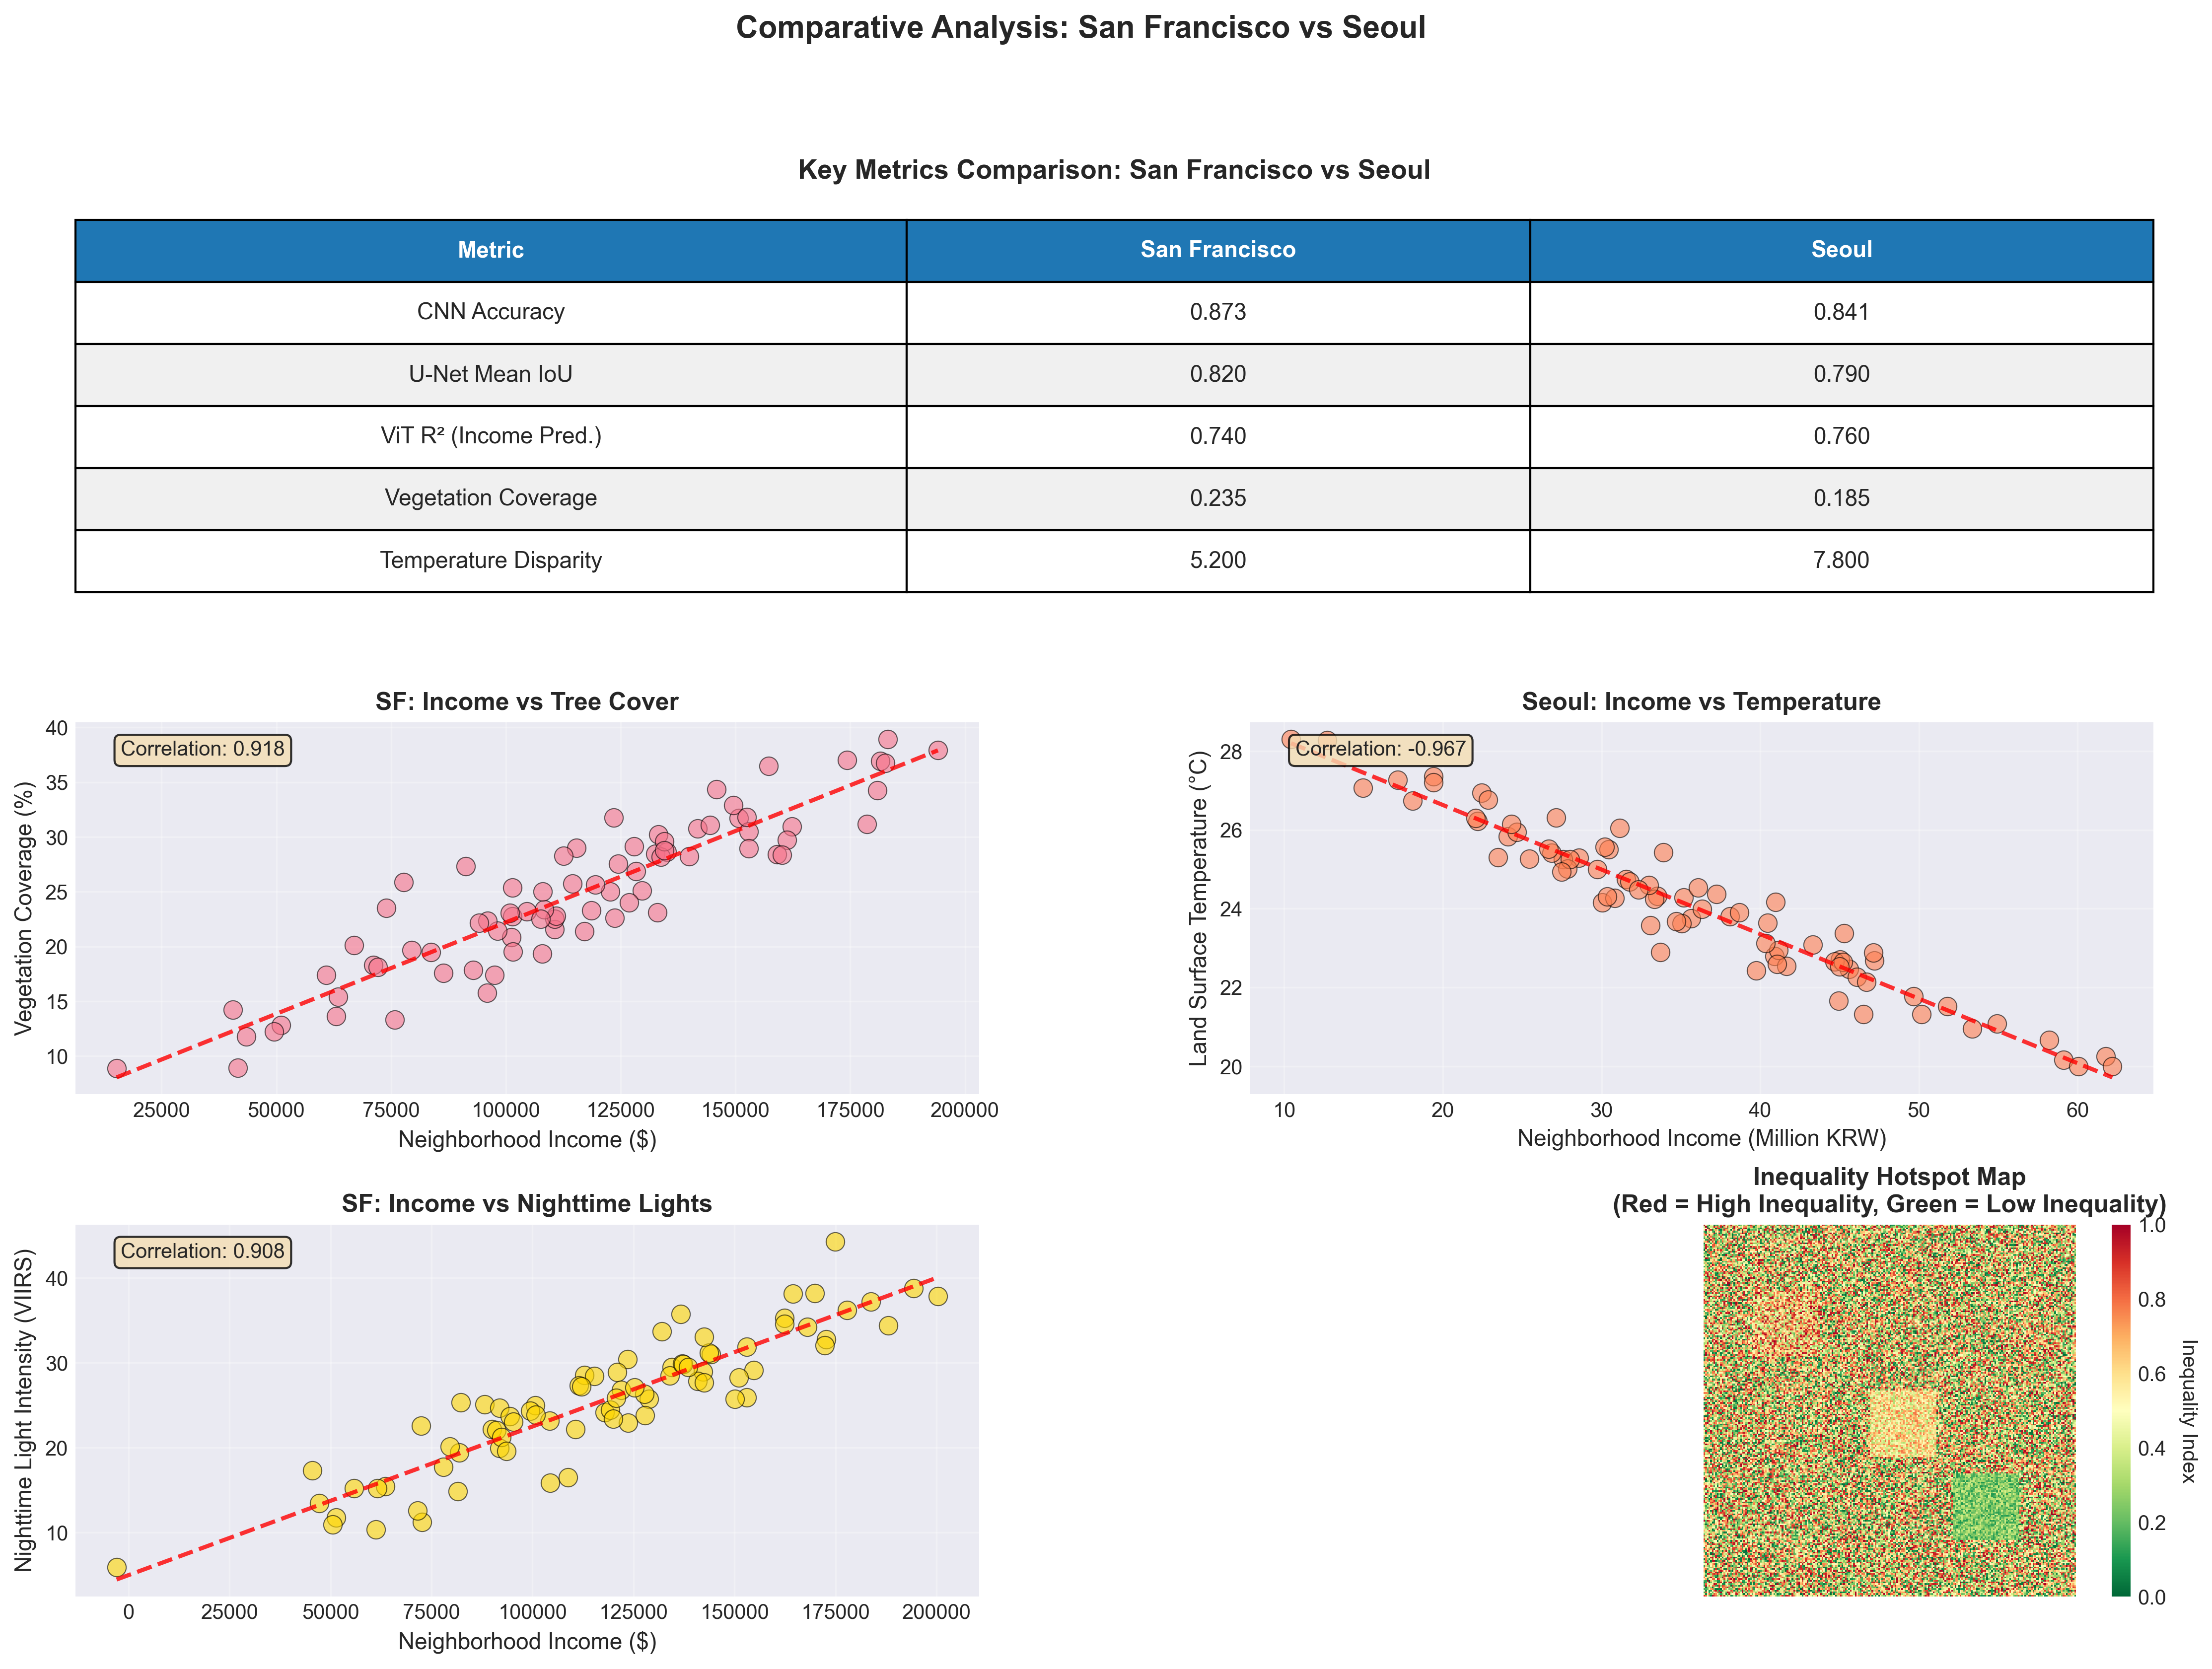
Do satellite images of two cities encode meaningfully different social and environmental signals — and can computer vision surface patterns of urban inequality that ground surveys miss?
Three modalities, one city read three ways
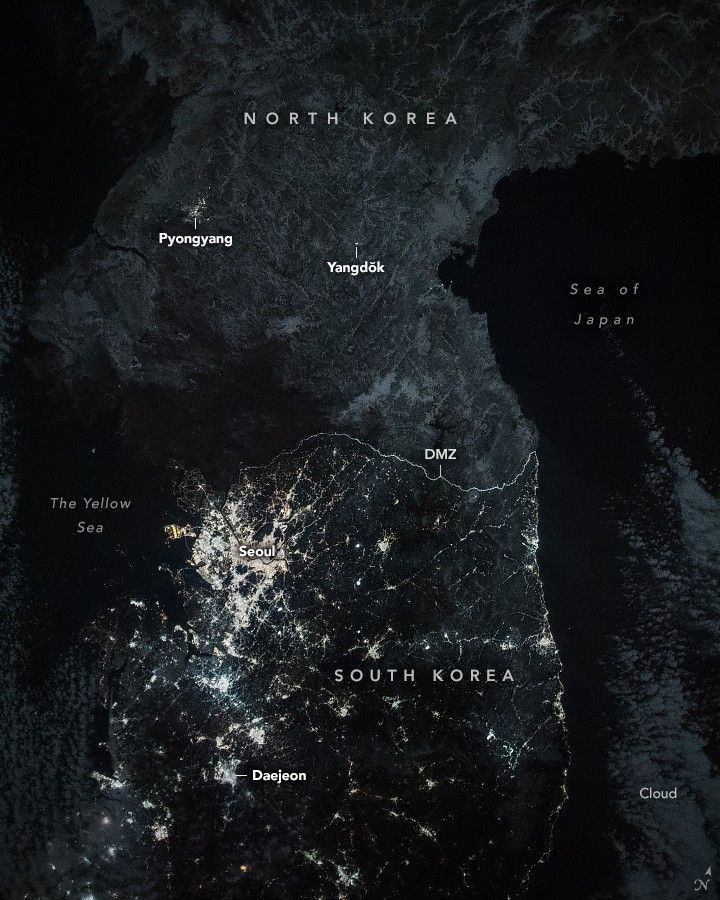
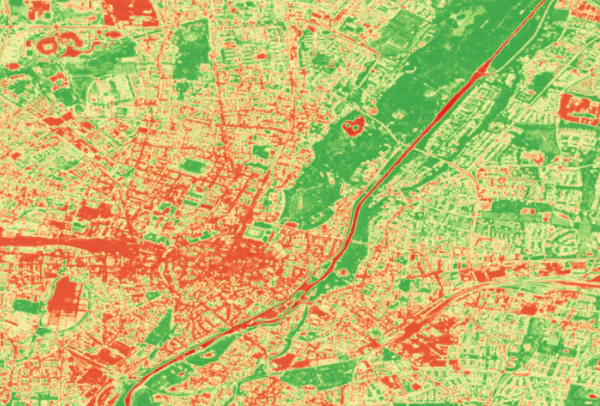
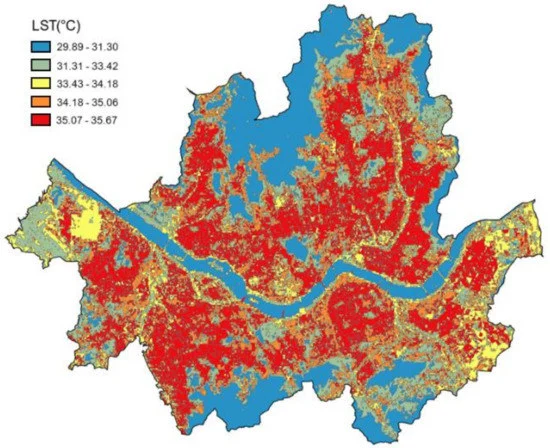
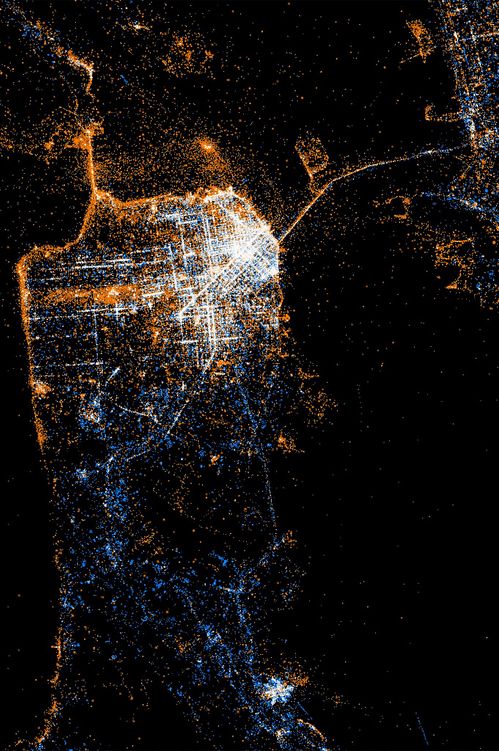
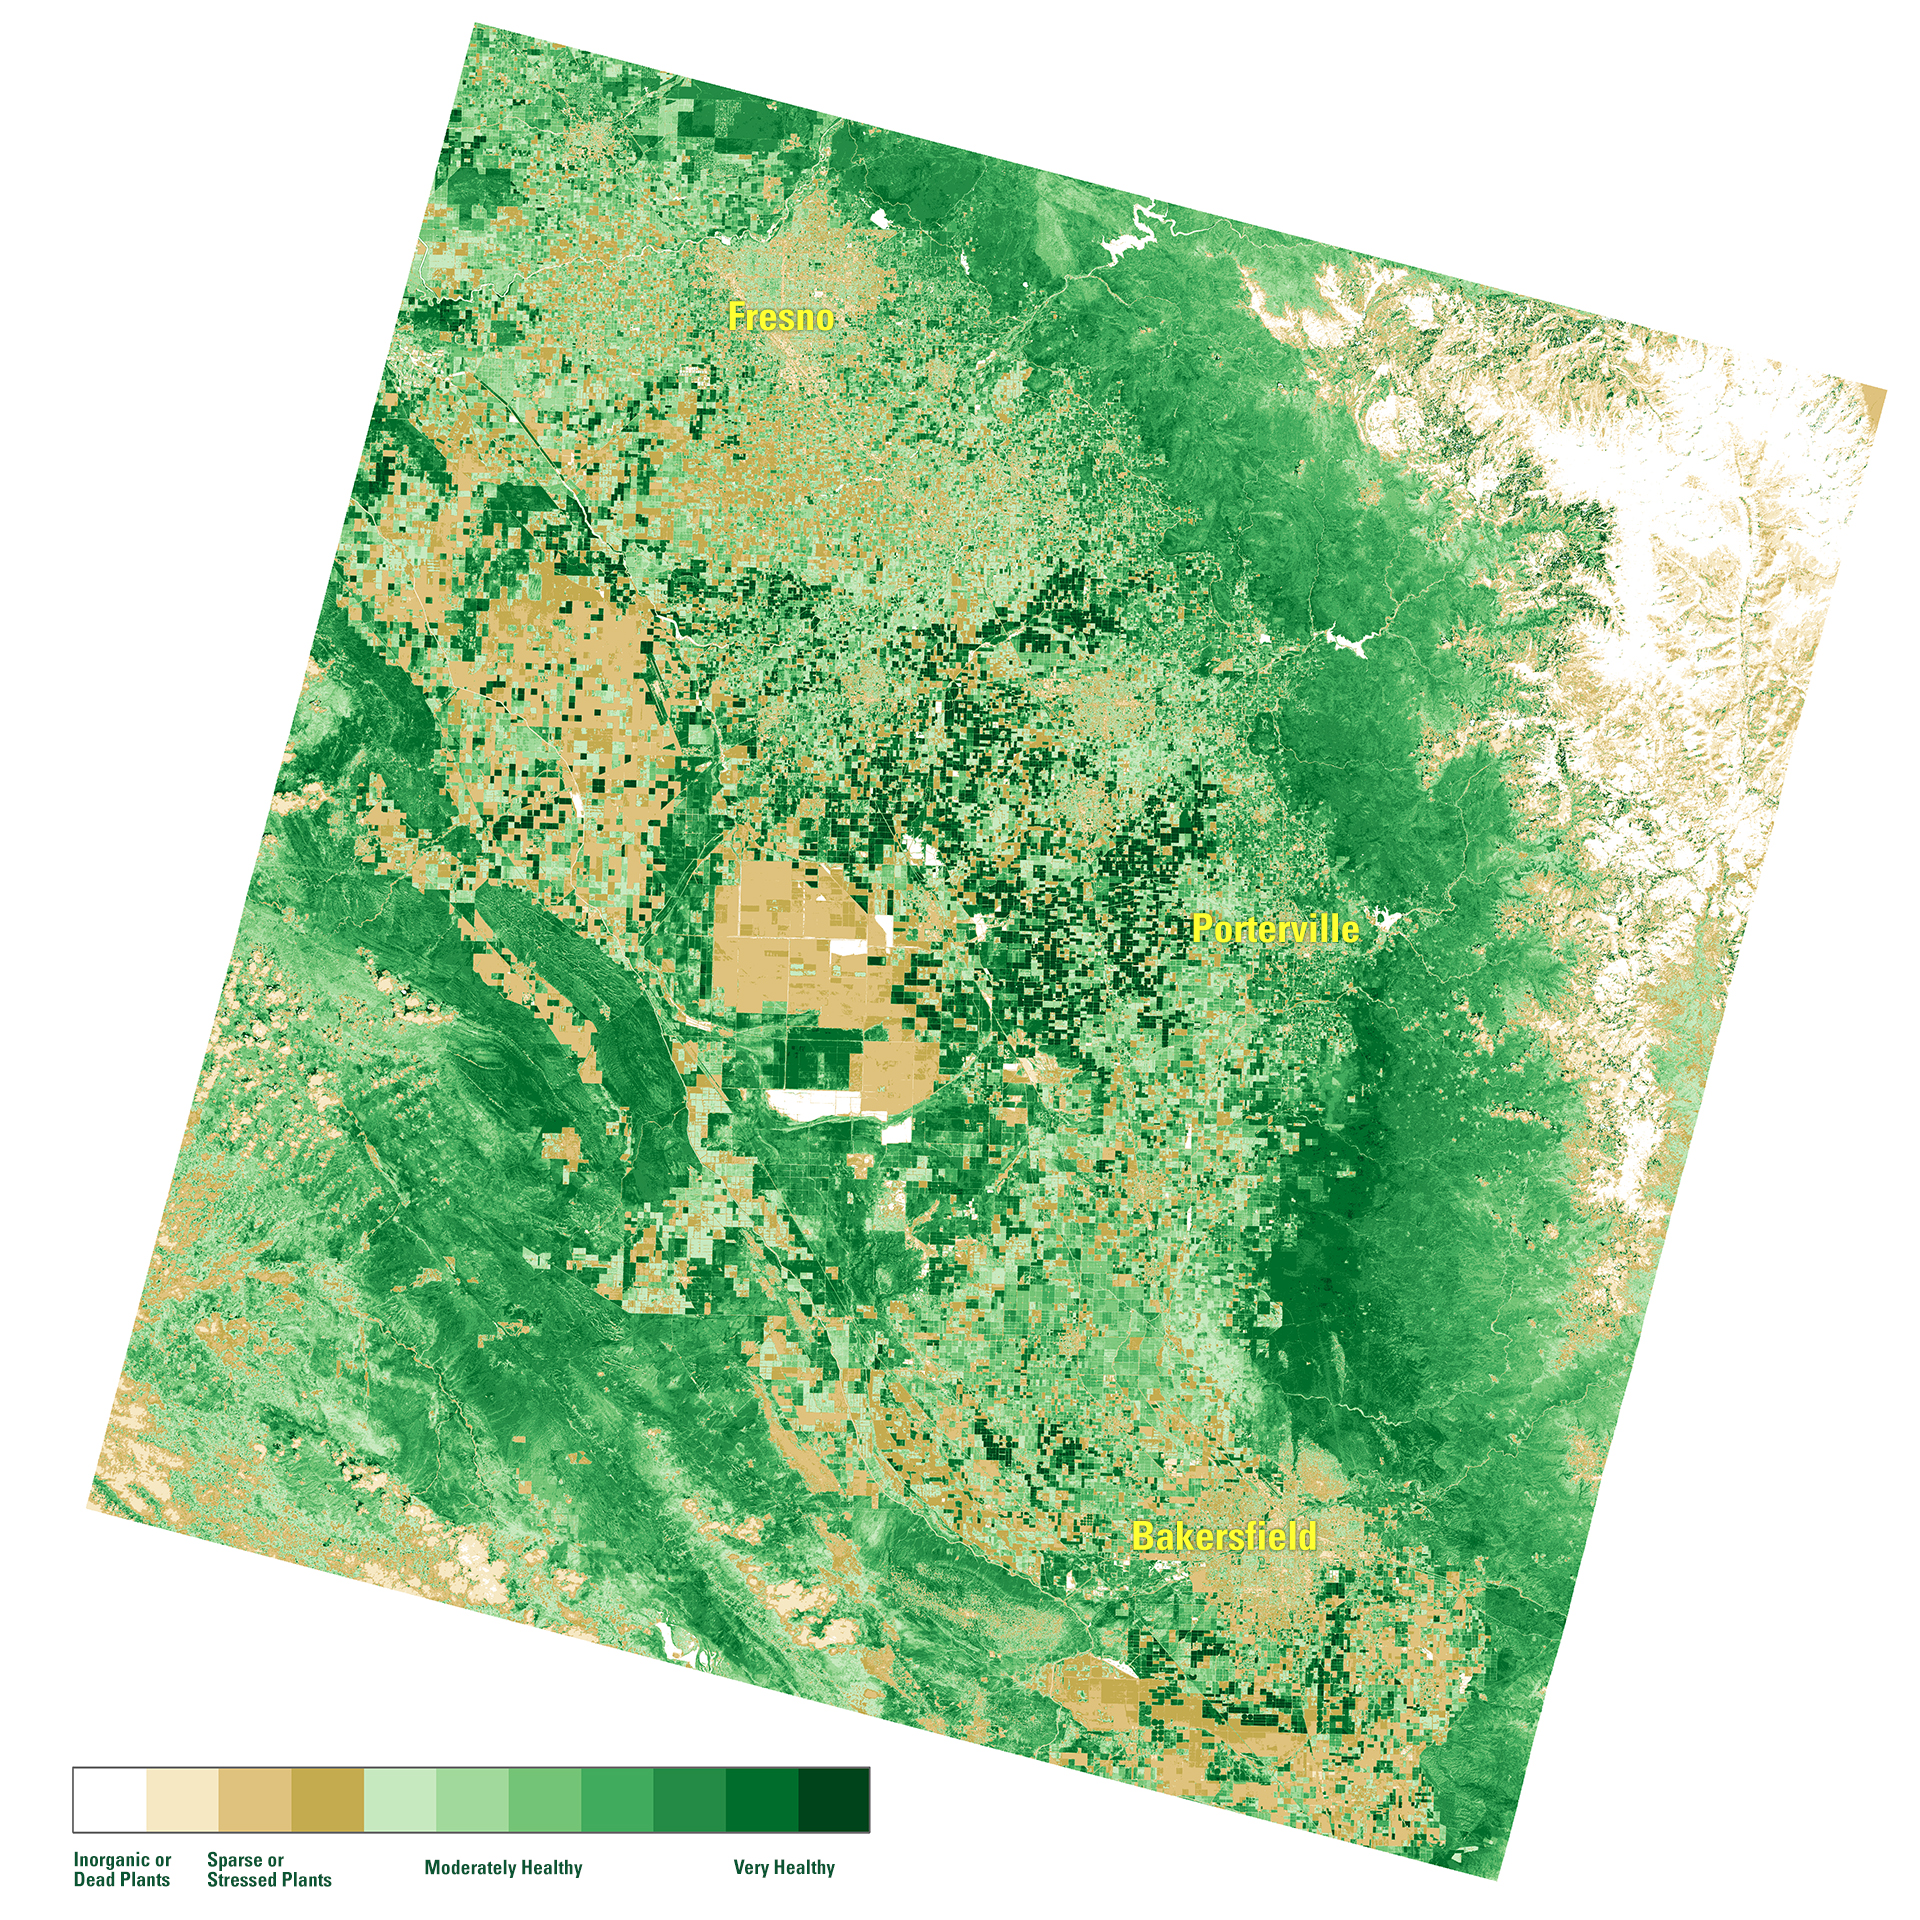
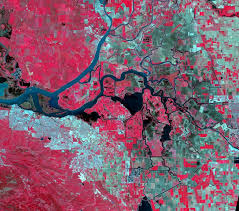
Each band answers a different policy question. Stacked, they describe who lives where, and how heat and green space are distributed across a city.
Why vision kept changing
Three architectures, three different failure modes — not a straight line to the "best" model, but a record of what the previous one got wrong.
ResNet-50 hits a wall
A whole-image classifier can say a tile is "urban" — it can't say where the block ends and the shadow begins. ResNet-50 kept losing the boundary between neighbourhoods whenever a cloud shadow crossed it, because classification throws away exactly the spatial structure a policy map needs.
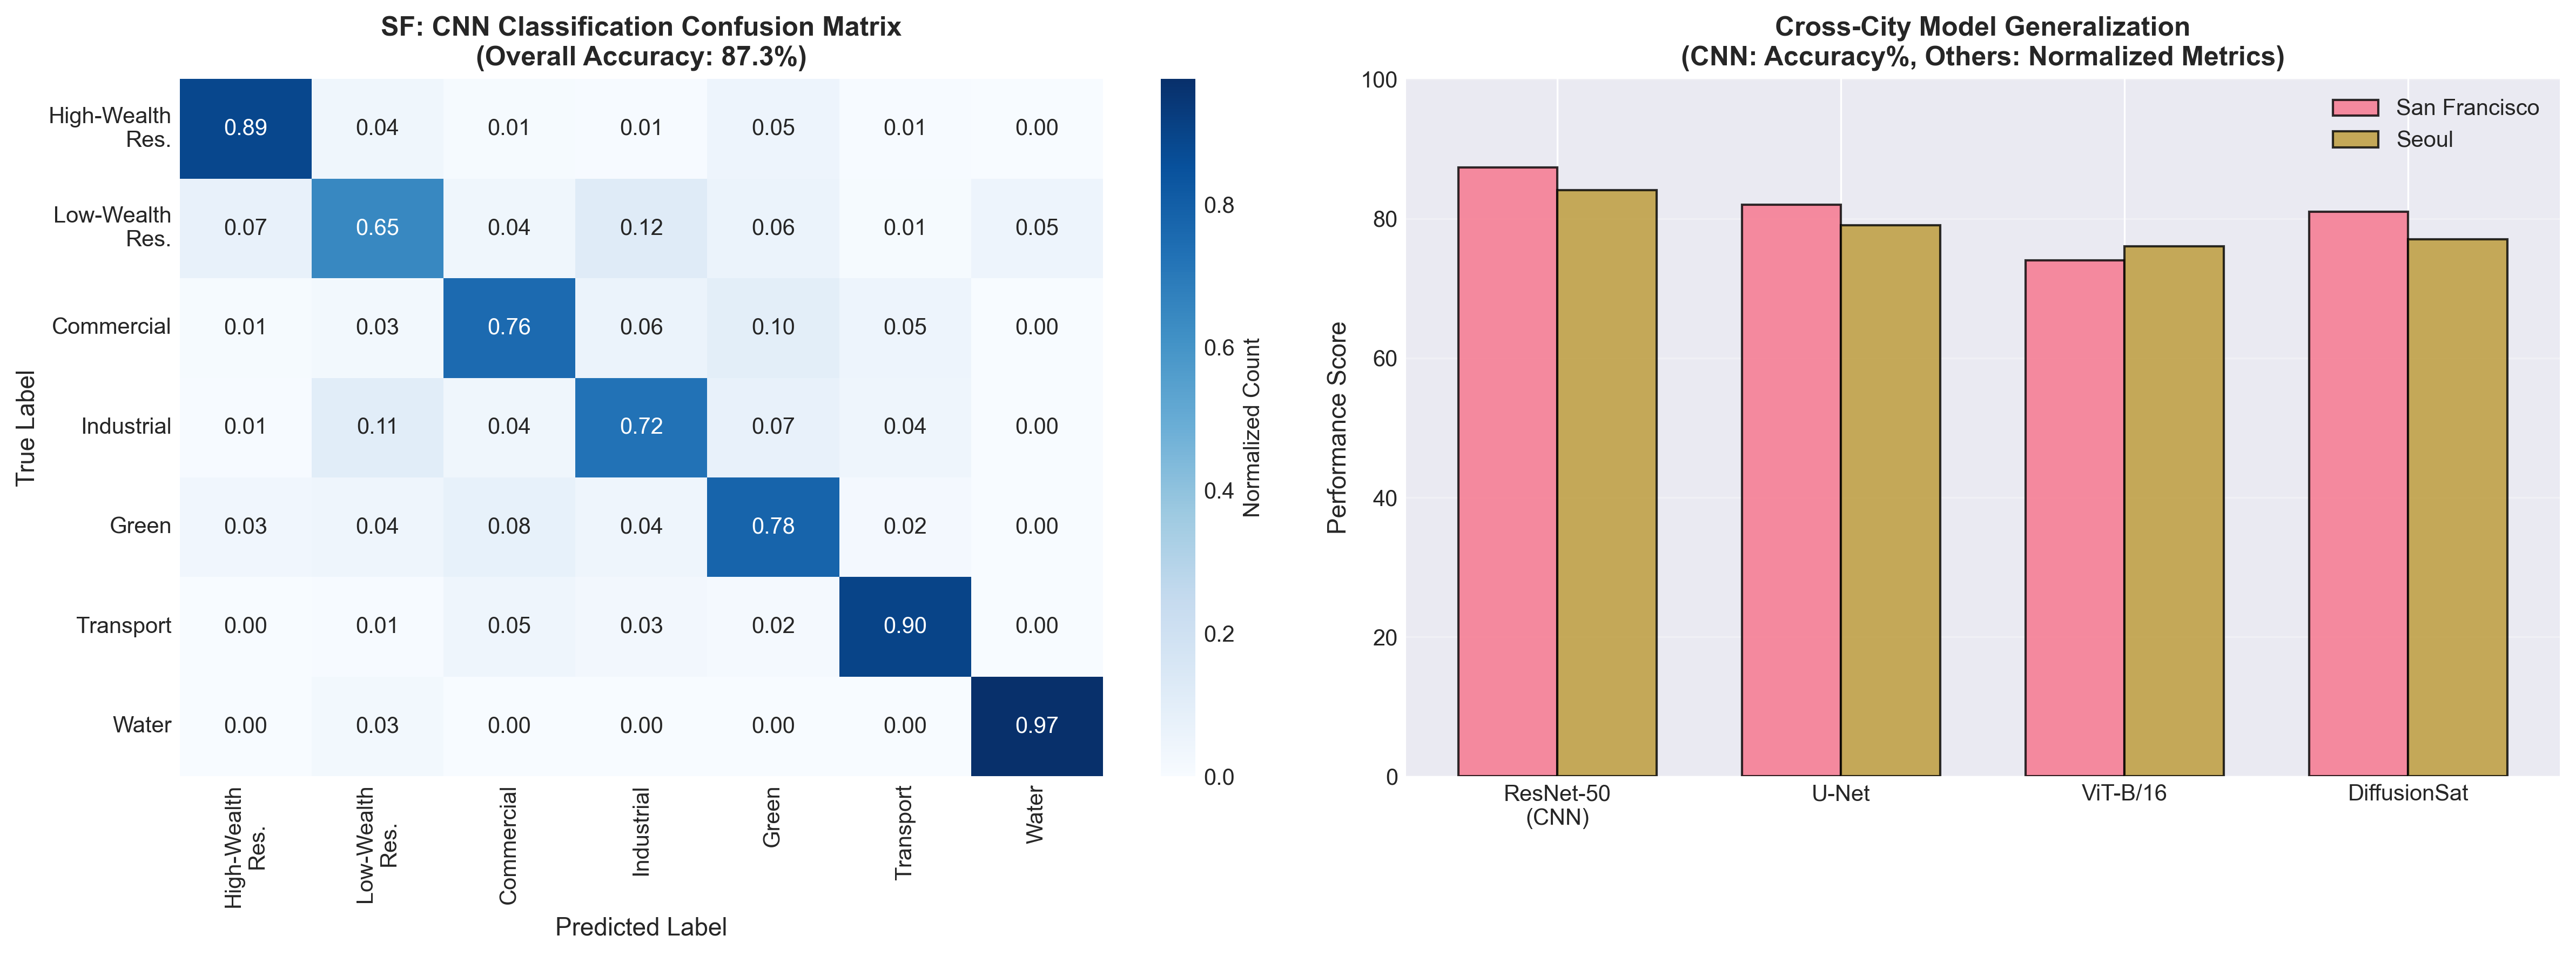
Less confident on low-wealth residential blocks — F1 0.79 in SF, 0.72 in Seoul — mistaken for industrial zones ~1 in 5 times.
Trading a label for a map
U-Net predicts a class for every pixel, so canopy is measured block by block instead of city-wide. At that resolution the two cities read differently: tree cover falls 35%→12% from wealthy to poor blocks in San Francisco and 28%→9% in Seoul, while building footprint runs the other way — 72% in poor neighbourhoods against 48% in wealthy ones.
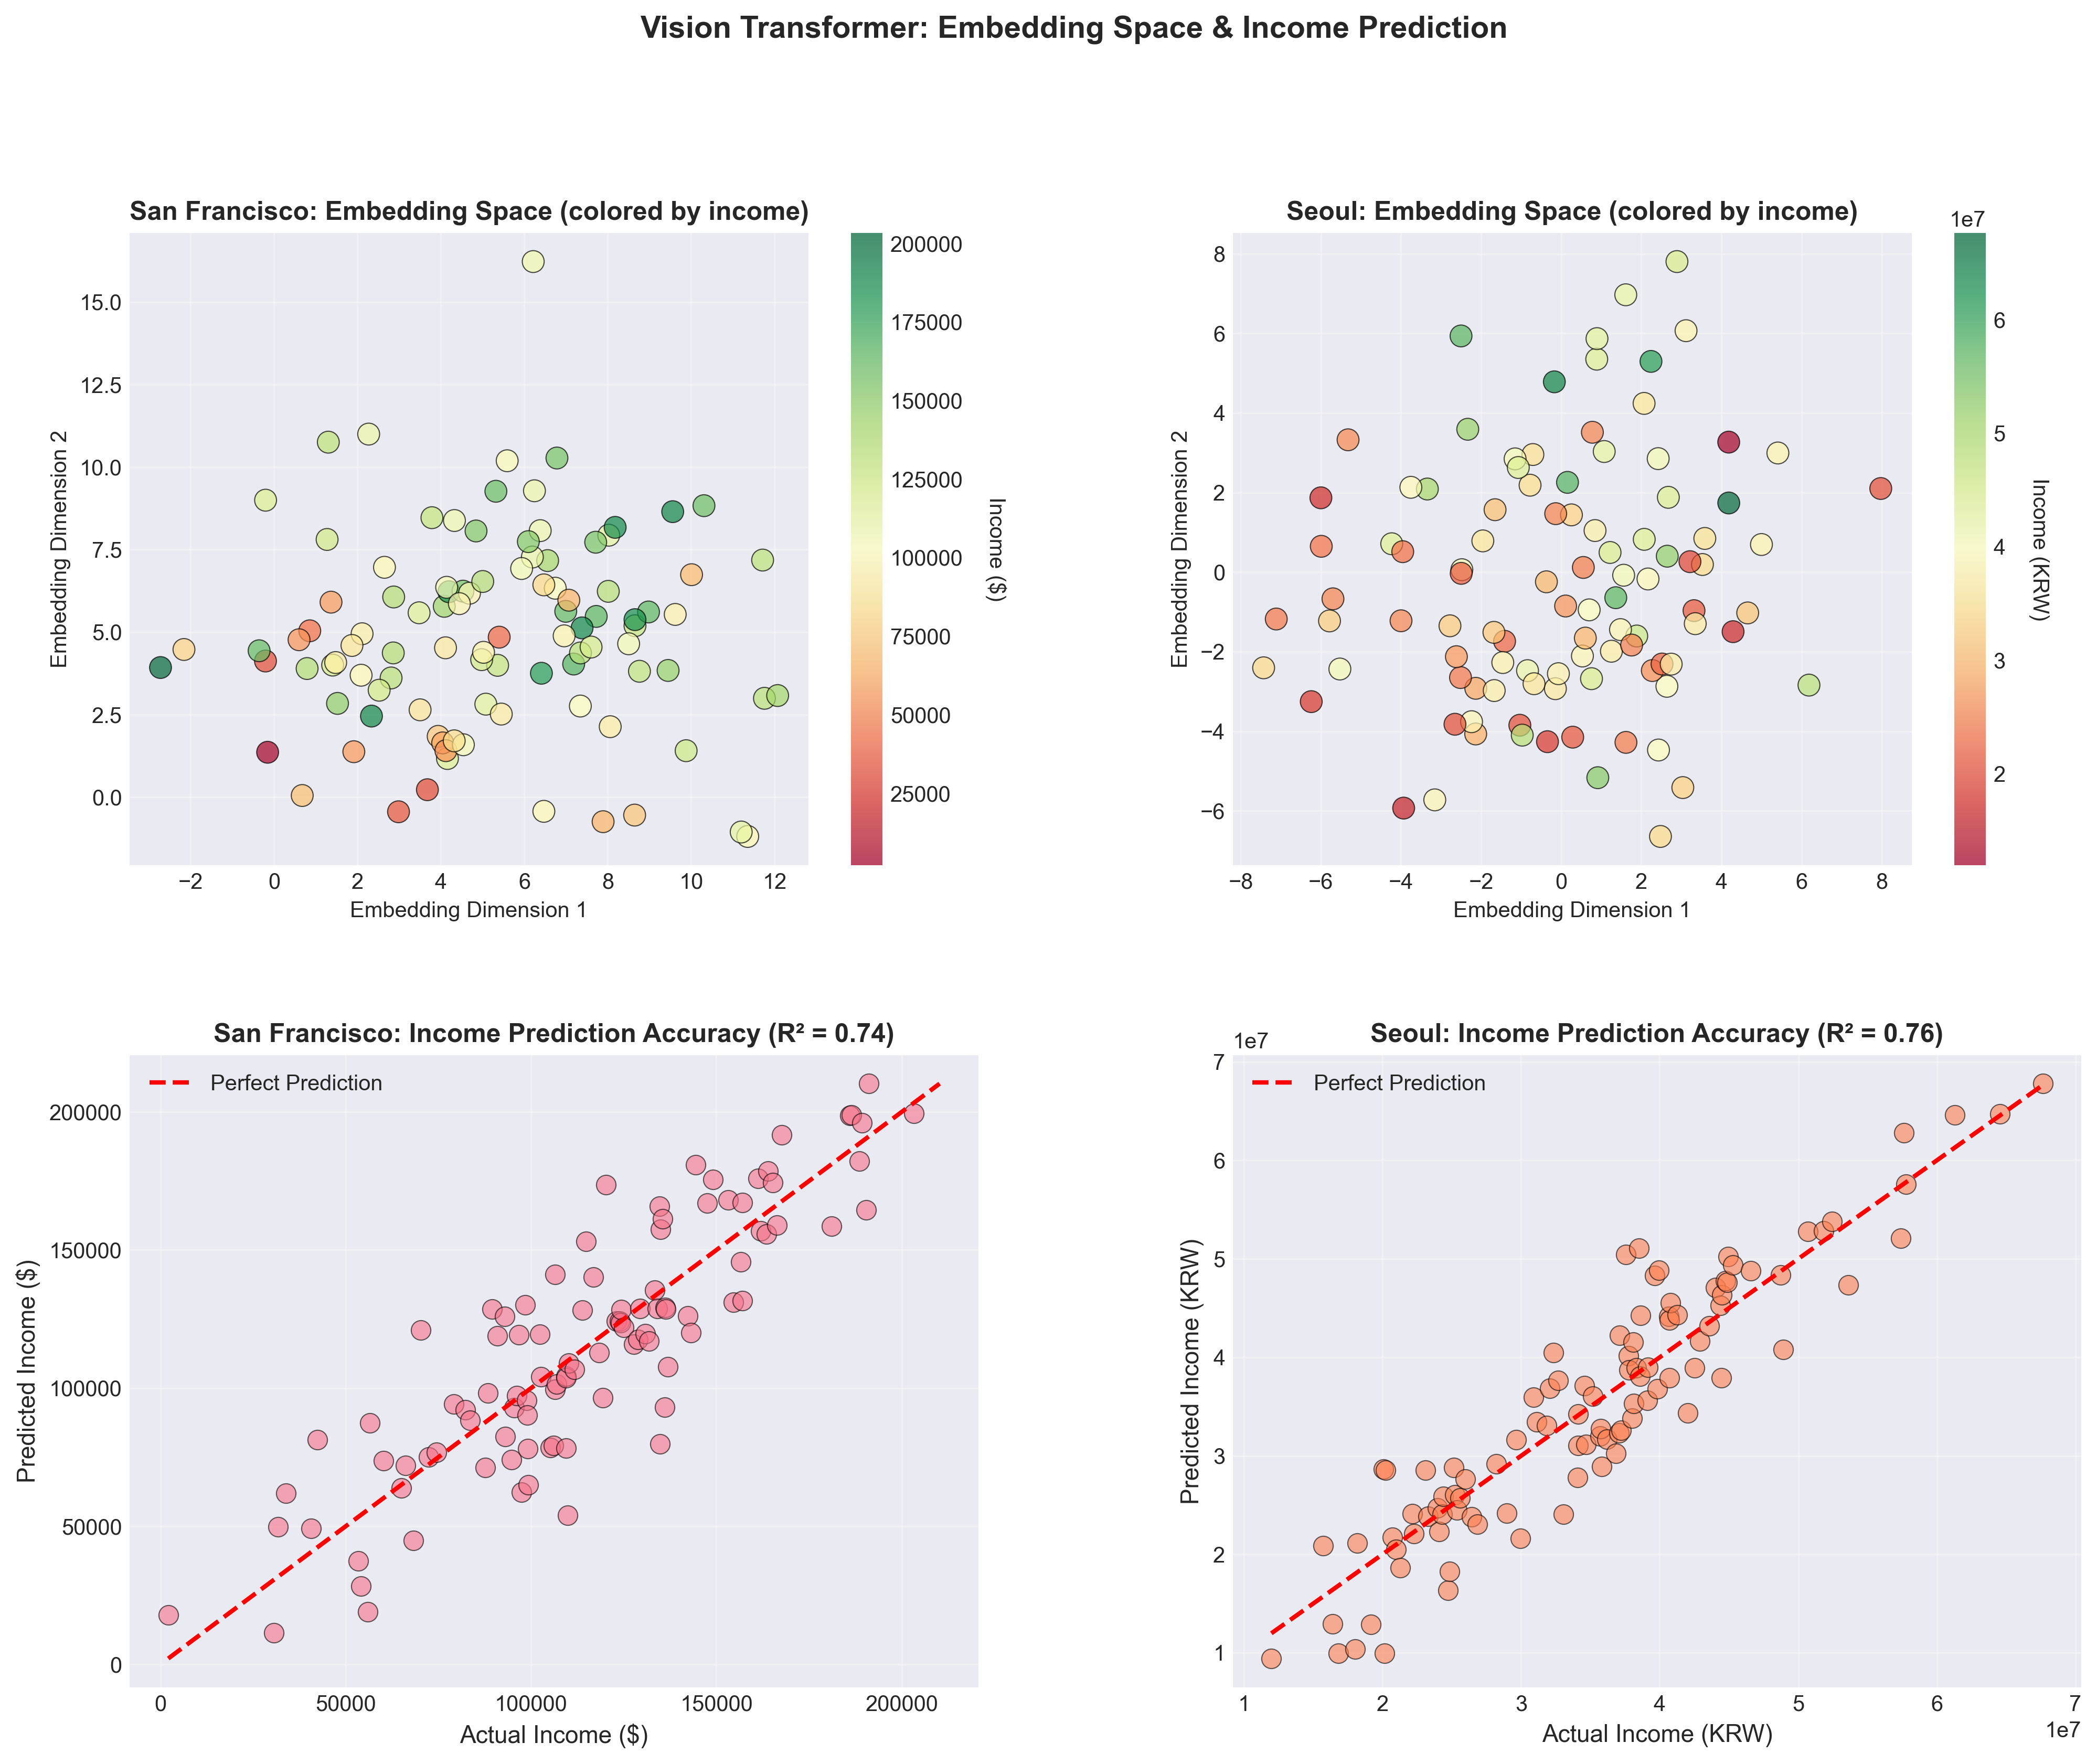
Letting attention find the pattern
U-Net only sees a fixed pixel neighbourhood. Self-attention relates any patch to any other across all 13 bands, catching city-scale structure a convolution misses — like a heat corridor that only reads as a pattern at full extent.